 Paper
Paper
 Code
Code
 Dataset
 Models

State of the Art Performance Across Task Categories
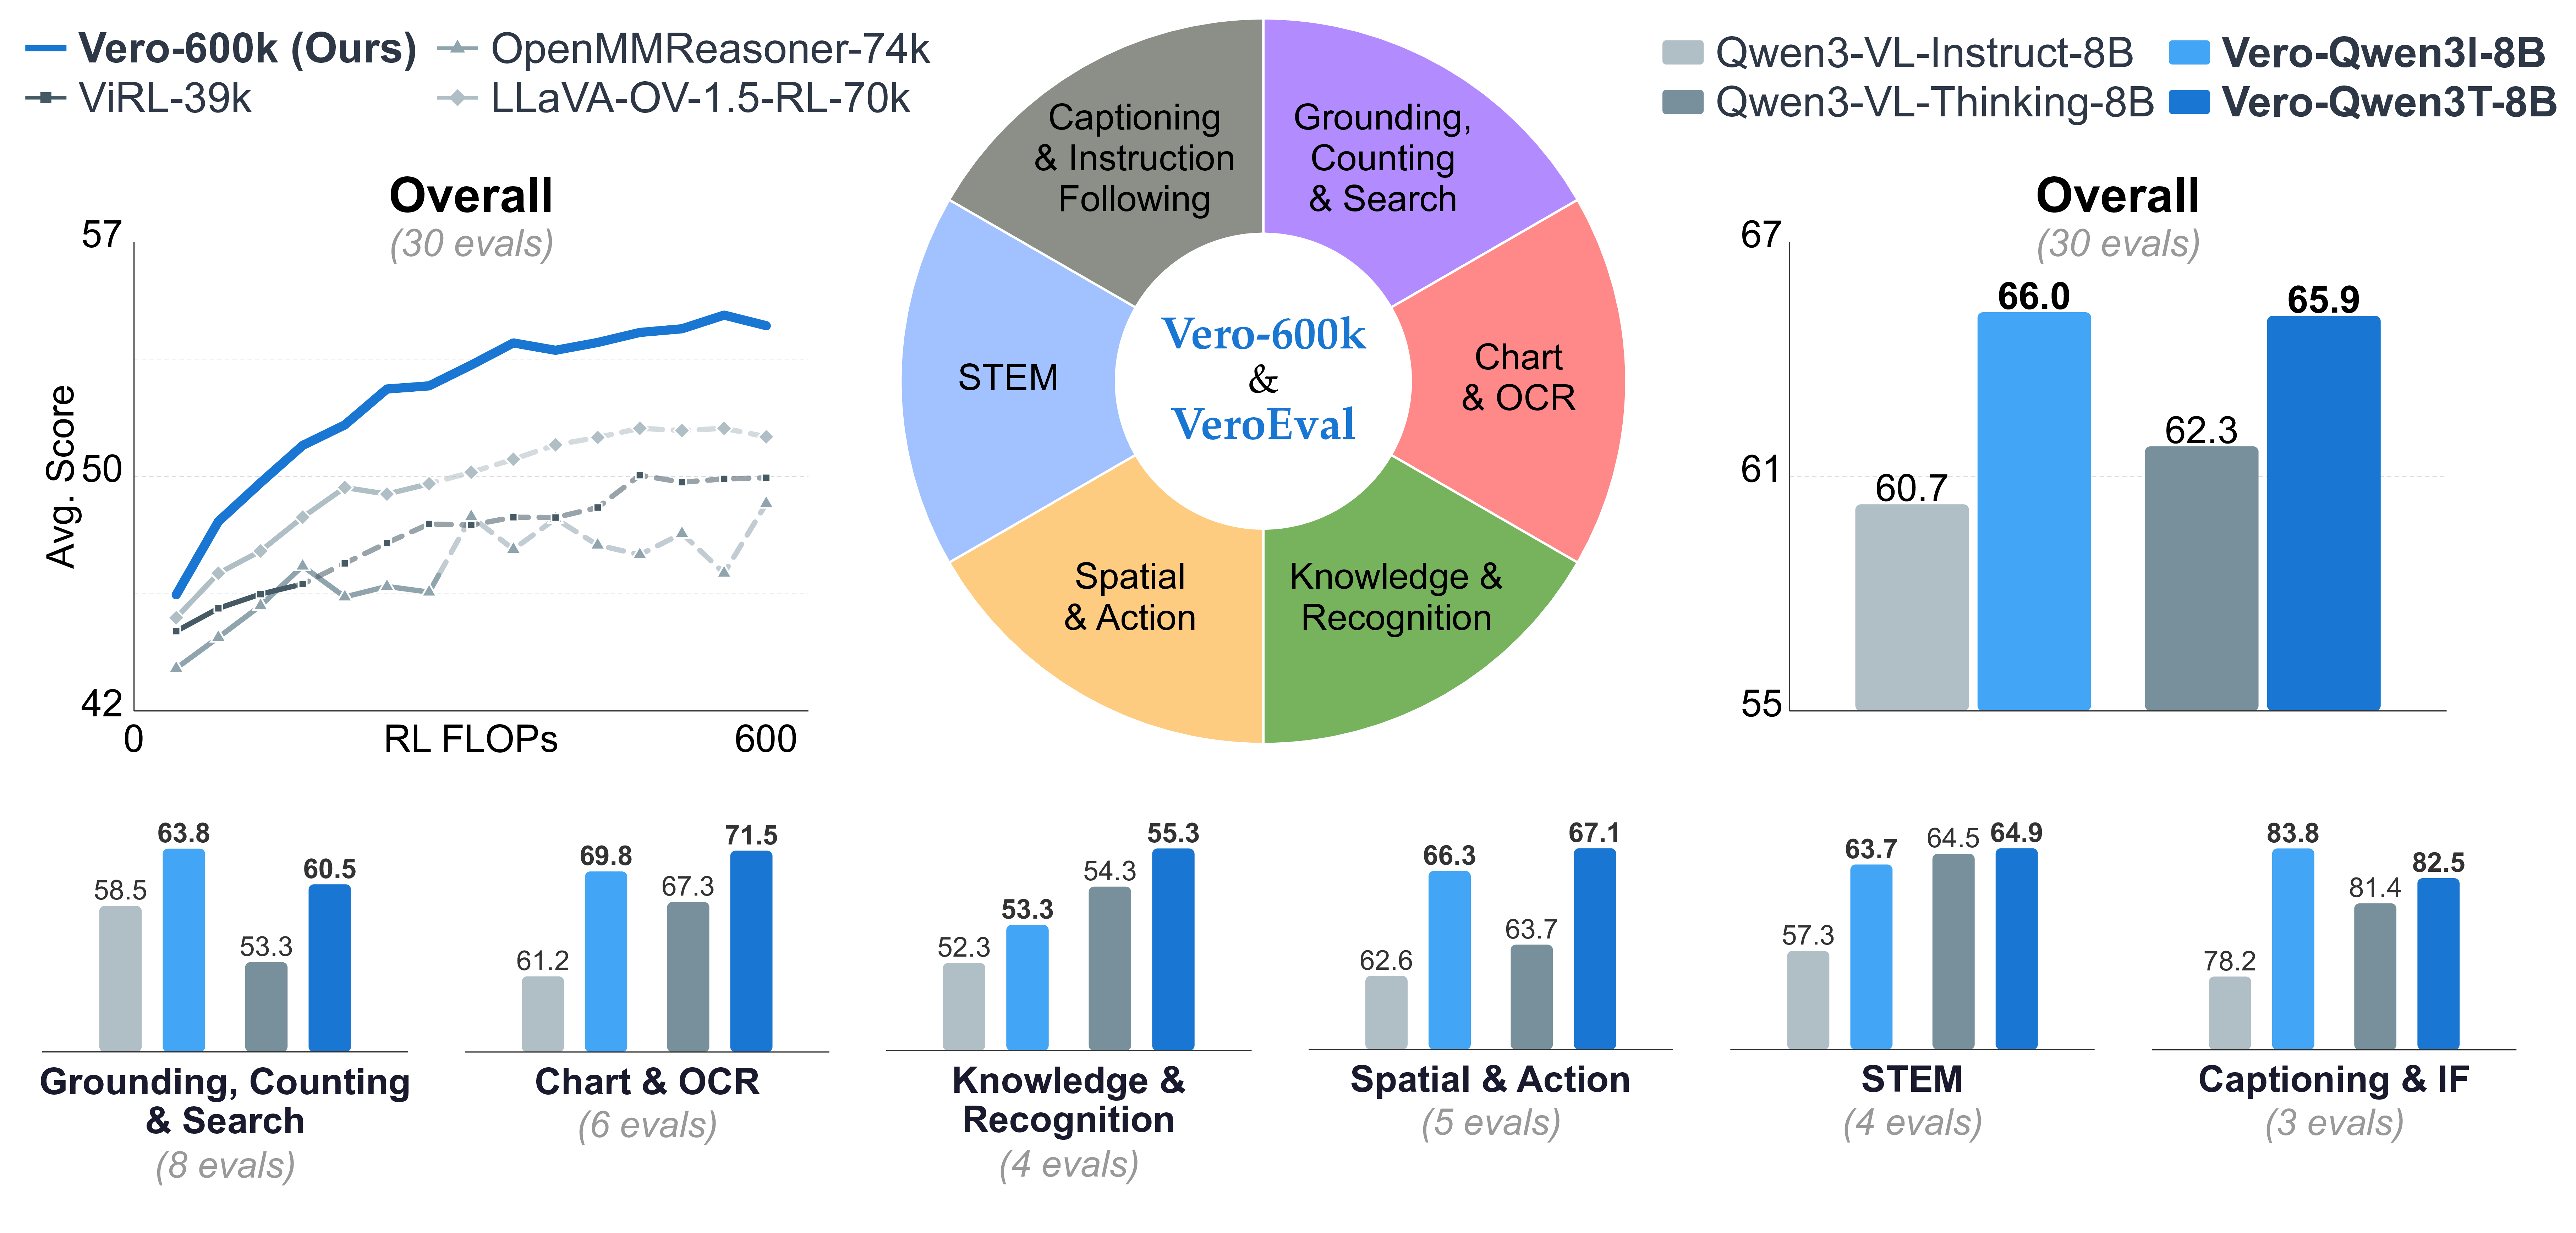
We evaluate Vero on 30 benchmarks spanning six task categories. The same open recipe improves four different base models and reaches state-of-the-art overall performance among 8B open-weight VLMs.
Starting from Qwen3-VL-8B-Instruct, Vero-Q3I-8B raises the overall average from 60.7 to 66.0, with category gains of +8.5 on Chart and OCR, +6.4 on STEM, +3.7 on Spatial and Action, +1.0 on Knowledge and Recognition, +5.3 on Grounding, Counting and Search, and +5.6 on Captioning and Instruction Following. Applied on top of Qwen3-VL-8B-Thinking, Vero-Q3T-8B reaches 65.9 overall versus 62.3 for the base model, with its largest gains in Grounding, Counting and Search (+7.2) and Chart and OCR (+4.2). The same recipe also improves Qwen2.5-VL-7B-Instruct from 52.9 to 57.9 and MiMo-VL-7B-SFT to 63.3, exceeding MiMo-VL-7B-RL at 62.4.
Vero Demos
Example conversations between a user and Vero across all six task categories. Each demo shows the model's reasoning trace and final answer.
Method
Vero trains on 600K curated RL samples drawn from 59 datasets organized into six categories: Chart and OCR, STEM, Spatial and Action, Knowledge and Recognition, Grounding, Counting and Search, and Captioning and Instruction Following. The categories correspond to substantially different use cases, visual inputs, reasoning patterns, and answer formats.
Vero uses a single-stage RL recipe directly on top of instruction-tuned or RL'd base models. Vero uses GSPO-style optimization with task-routed verifiers, so numeric questions, multiple choice questions, grounding boxes, clicks, ordering problems, and open-ended instruction-following outputs.
Data Diversity and Transfer
We show that single-task RL does not generalize reliably across visual capabilities. Training on one category often improves that category while degrading others, especially Grounding and Captioning and Instruction Following. This is consistent with classic multi-task RL results showing that heterogeneous tasks can interfere and that task contributions must be balanced during training (Teh et al., 2017; Hessel et al., 2019). By contrast, the mixed model produces positive gains across categories and avoids the catastrophic spillover seen in single-task-category RL.
Behavioral Analysis
Different task categories do not simply induce more or less reasoning — they induce qualitatively different reasoning styles. STEM tasks trigger reflective, backtracking-heavy traces; grounding tasks favor direct perceptual search; chart tasks produce systematic regional synthesis. These distinct patterns help explain why single-task training transfers poorly: the model adapts not just its answers, but its reasoning policy.
Reasoning Length by Task Category
Beyond qualitative differences in reasoning style, task categories also elicit markedly different reasoning lengths. Spatial & Action produces the longest responses at 1,983 ± 51 words, followed by Chart & OCR (1,593 ± 32) and STEM (1,576 ± 40). Captioning & Instruction Following is much shorter (414 ± 13), while Grounding, Counting & Search (125 ± 13) and Knowledge & Recognition (76 ± 3) are shortest. The gap between the longest and shortest categories exceeds 26×, suggesting that long chain-of-thought behavior is concentrated in tasks requiring multi-step spatial state tracking or structured analytical decomposition.
Interactive UMAP
The stacked-bar summary highlights the same task category separability at the category level. The interactive UMAP below shows the same story at the individual-skill level, where clusters can be inspected directly by task category, label, and description.